BookSpring’s annual Texas Reading Survey analyzes reading trends, attitudes, and behaviors in Texas households. These results will help us better understand what is going on with reading in the communities we serve so that we can refine our programs and direct our services more strategically in the coming year. While the survey asks 40 questions, the metrics we are watching most closely are the number of books in the home, the frequency of reading together, and details about the use of digital devices for reading, both independently and together as a family. This year’s survey targeted a broader population, spanning all of Texas. This differs from previous years, in which the Texas Reading Survey was distributed across only Central Texas. Once again, we surveyed a primarily English-speaking population and a Spanish-speaking population with identical questions. In comparison to the 2022 survey, there was an approximate 50% increase in survey respondents as a result of this shift in our targeting approach.
Home Libraries Recover Slightly in 2023

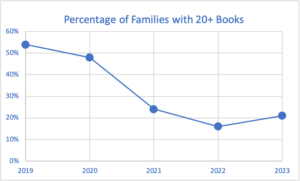
In 2023, we are seeing an overall increase in the number of households with 20 or more books. In combination with both surveys, we are reporting a 2% increase in 20 or more print books in households. Consistent with last year’s survey, the number of books in the household was distinguished by two categories. One category only included the total number of children’s books in the home and another included both adult and children’s books.
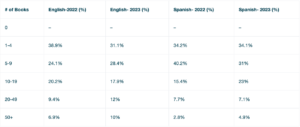
In 2023, 31.3% of households contained 1-4 children’s books, making up the majority. In comparison to 2022 in which 38.9% of households had 1-4 children’s books. This year we report that 22% of the surveyed English population contained 20 or more children’s books. This is a significant increase from last year in which 16.3% of households in 2022 contained over 20 children’s books. Similarly in the Spanish survey, 11% reported having 20 or more children’s books in comparison to last year’s 10.3%. However, research shows that growing up with 20 books or more in the home is a significant factor in future educational success, so this result is still far lower than we would like it to be.

Frequency of Reading Aloud Continues to Grow
Communicating and illustrating the importance of reading aloud to children is a central part of our mission. We aim to provide resources and training that encourage and create ease for families to read together. In measuring the frequency of households who read aloud to their children “once a day,” we reported a 3% decrease from the previous year. However, there was a relative 6% increase in households who began reading “twice or more a day.” In 2022, 21% of households said they read “twice or more a day,” whereas, in 2023, 27% of households read “twice or more a day” out loud. This is an indication of a higher frequency of reading out loud from the previous year.
Reading Together on Digital Devices on a Steady Incline
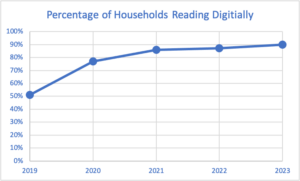
 It is shown that over 90% of households utilize digital devices in some capacity whilst reading. As seen in the below figure, we are seeing a continuous increase per year in digital literacy, indicating an increasing demand for digital resources within families. We reported an overall 4% increase from the previous year. Our English survey showcased a 3% increase and our Spanish survey reported a similar 6% increase from the previous year. Increased access to digital devices and digital opportunities continue the upward trend of reading digitally. More and more, families are utilizing phones and tablets as resources for their children in various aspects of their upbringing.
Reading Culture within the Home
This survey analyzed reading culture within the household to determine possible factors in attitudes towards reading aloud, reading frequency, and support for physical books. While over 86% of parents/caregivers report (on a scale of 1-5) that reading is important to their children, only 72% strongly agree with this statement. This is a slight decrease from previous years and indicates a need for increased education efforts among caregivers.
The 2023 survey reports that over half, about 59%, of respondents believe that their children very much enjoy reading. Over 47.1% of caregivers report that they feel bad or very bad (on a scale of 1-5) when they do not read to their child every day. Approximately 38% of respondents report that reading to their children is difficult or very difficult for them. Similar to previous years, these statistics indicate that a large percentage of caregivers recognize a need for support or guidance. Within surveyed households, approximately 72% of participants report that print media is still overwhelmingly their preferred form of consumption. 18% of respondents prefer reading on their computers. 19% prefer reading on their phone. Other formats are negligible.
Activities versus Reading
Other activities may contribute to an absence in childhood reading. This data is important in identifying where our target demographic is spending the majority of their time relative to reading in order to adjust our programs and outreach approach. 40% of children were reported by caregivers to spend more time watching television than reading. 55% report that their children spend more time playing outside than reading. 40% report that their children spend more time doing arts and crafts rather than reading. Digital devices play a significant role in this offset as well, reporting approximately 37% of children spend more time playing on phones or tablets compared to reading.
BookSpring Brand Recognition

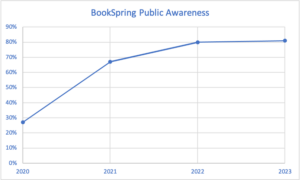
This year we continue to report an increase in organization name recognition and brand awareness in comparison to previous years. This is likely attributed to an uptick in public relations and marketing efforts. Similarly, the introduction and promotion of BookSpring Fest, a free read-aloud celebration, may have contributed to increased public awareness. Overall, when asked if participants had heard of BookSpring prior to the survey, 81% responded “Yes.” Responses via the English survey remained relatively the same from the previous year. Spanish populations reported an approximate 4% increase.
Income Variants Indicate Discrepancies
Only 16% of respondents reported a household income of less than $40,000. Therefore the results of this survey are not entirely representative of our target population. Over 57% of respondents indicate an income between $40,000 and $80,000, however, this item does not factor in for size of household. Because a minority of our target demographic is represented, even with the larger sample size this year, caution should be used about generalizing the results. Similarly, the surveyed racial demographics varied widely. 17% of respondents identified as Hispanic or Latino. This is a 10% increase from the previous year. However, we see a significant drop in the percentage of African-American respondents, with only 3% of this year’s survey identifying as African-American. This is a 15% notable decrease from 2022. These variations in demographics may account for the changes observed in regard to attitudes towards reading resources and need levels.
Methods and Collections
This study was conducted in September 2023 with a panel screen for language, location and the presence of children in the home using Mechanical Turk. There were 411 respondents to the English Survey and 227 respondents to the Spanish Survey. The questions remained the same as in the previous four years, aside from location identification, which was broadened for the purpose of this survey. As a result, there was a higher overall response rate in comparison to previous years. This report was compiled by Ana Krueger.
Survey Results
2023 Texas Reading Survey Results- English
2023 Texas Reading Survey Results- Spanish

